
A collaborative community website focused on protecting, monitoring,
and learning about the connectivity of water resources in Plymouth
and beyond. Funded in part by a grant from the Massachusetts
Municipal Vulnerability Program to the Town of Plymouth.

Tidal Signature in Coastal Well
Salt Water Intrusion Testing and Monitoring
By
Peter Schwartzman
on August 7, 2023
Under its data collection program, the Plymouth Saltwater Intrusion Task Force installed a datalogging transducer in a coastal Ellisville well located about 450 feet from the shoreline. The transducer measured water level, specific conductance (SC) and temperature. The plot below shows how tidal variations in Cape Cod Bay affect water levels in the well. The salinity (expressed as SC) was not affected by tidal variations. Groundwater quality shows low salinity and is not impaired relative to drinking water standards.

Walks by Malcolm
Hike & Learn: Aquifer Adventures
By
Glorianna Davenport
on May 29, 2023
Malcolm Macgregor's powerpoint, Plymouth Aquifer Hiking, outlines several hikes that you can take to explore how the topography of Plymouth relates to three of Plymouth's watersheds: Eel River Watershed, Beaver Dam Brook Watershed, and Agawam River Watershed.

Herring Lady, Nancy Carroll, at Plymouth Herring Festival in 2022
Plymouth Herring Run Festival--April 21 and 22
By
Glorianna Davenport
on May 17, 2023
The Herring Lady is a beloved icon of this festival. Alas, I not manage to see her this year, which doesn't mean she wasn't there. Here she is in the outfit she created for the 2022 festival.


Groundwater model, salinity, and stratigraphic update
Hydrogeology of Coastal Aquifers of Southeast Massachusetts: Assessment of the impacts of the combined effects of sea-level rise and terrestrial climate change
By
Alexander Kirshen
on March 9, 2023
The major updates to the groundwater flow model are: (1) the grid for the groundwater flow model is finalized, and (2) a density-dependent model was run to represent the salinity distribution in the aquifer. In the zone most likely to experience saltwater intrusion (8 to -32 meters above sea level), the grid cells have a finer vertical spacing to detect precise changes in saltwater intrusion. In Figure 1, the interface between saltwater and freshwater can be seen near the coast, with more dense ocean water (red) flowing under the less dense freshwater (blue).
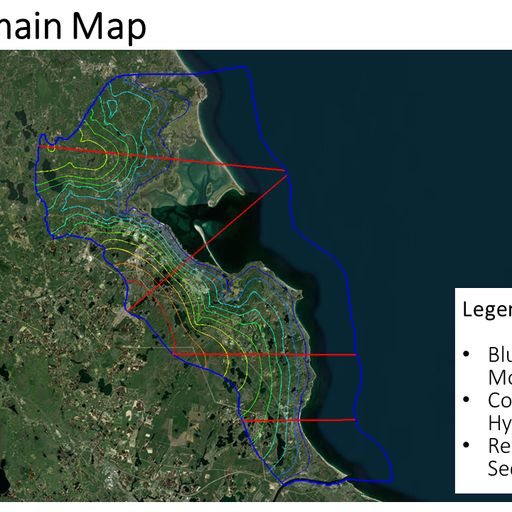
Groundwater Model Update
Hydrogeology of Coastal Aquifers of Southeast Massachusetts: Assessment of the impacts of the combined effects of sea-level rise and terrestrial climate change
By
Alexander Kirshen
on January 9, 2023
(updated January 10, 2023)
We developed a homogenous density-dependent groundwater model simulating groundwater flow in bedrock and overburden sediments. As seen in the image of the cross-sections, an interface forms between the more dense ocean water (red) and the less dense freshwater (blue). Also included is an image of the modeled hydraulic head; you can see that the hydraulic head decreases moving toward the coast (east). In this aquifer system, hydraulic head can be thought of as the elevation of the water table. We are now revising the stratigraphic framework for the region using state well logs which will be incorporated in future model simulations.
